
Tooling to help debug your Sitecore Docker Containers
Kamruz Jaman - Solution Architect
8 Apr 2020
The world of containers seems to be on a very fast-paced development cycle at the moment from everyone - Docker, Microsoft, and the Sitecore community at large.
If you have created your first Docker image and started your first Sitecore container, then no doubt you have read through the Sitecore Docker for Dummies posts by our good friend Mark Cassidy. For those of you jumping into the world of Sitecore Docker, we thought it might be helpful to share some recent updates to help you in the debugging world.
Visual Studio 2019
First off, upgrade to the latest version of Visual Studio 2019. Make sure you are on version 16.5+. I cannot stress this enough, the tooling is a really nice integration.
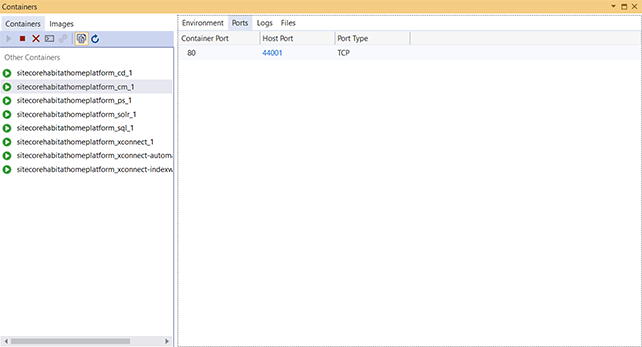
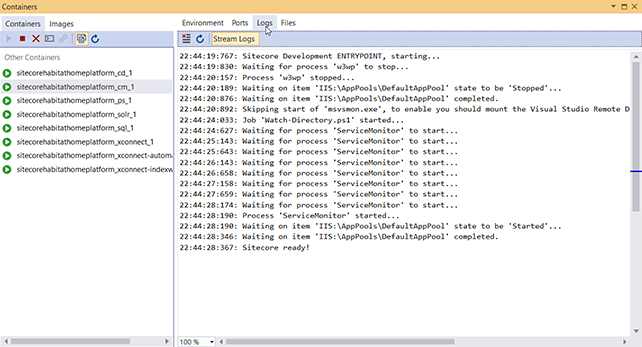
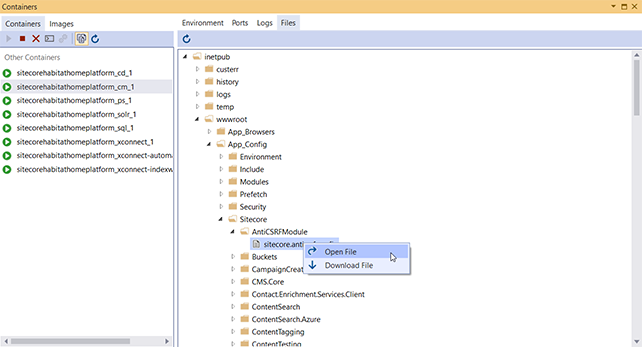
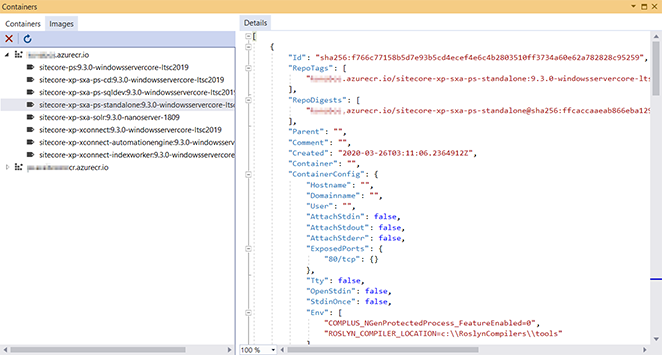
Then from the menu select View > Other Windows > Containers. 🎉
The Containers window will then show you a list of all the containers on your machine. You can select each individual container and the tab through the Environment Variables, mapped Ports, the Logs for the container and there is also a Files tab.
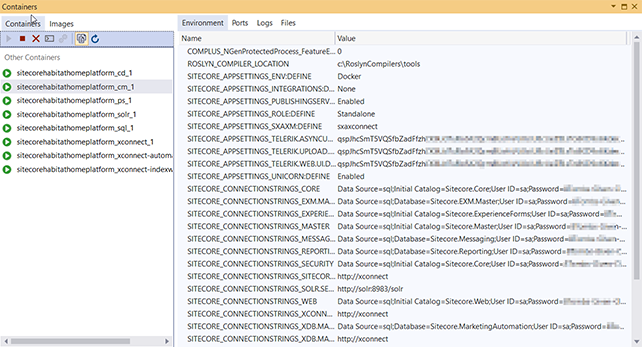
You can already browse files inside a container via PowerShell (docker exec -it CONTAINERID powershell), but for those of us that like a visual GUI this is great to take a look around the file system and even to open the files and see the contents.
You can also see a view the local images on your machine, grouped by registry.
You can read more about these changes here: https://docs.microsoft.com/en-us/visualstudio/containers/view-and-diagnose-containers?view=vs-2019
I would also suggest taking a look at the PowerShell Remoting Explorer by Micheal West. It’s a great utility to have on your belt.
There are also some nifty Docker tools available in VS Code via the extension. Definitely worth checking these out as well.
VS Code
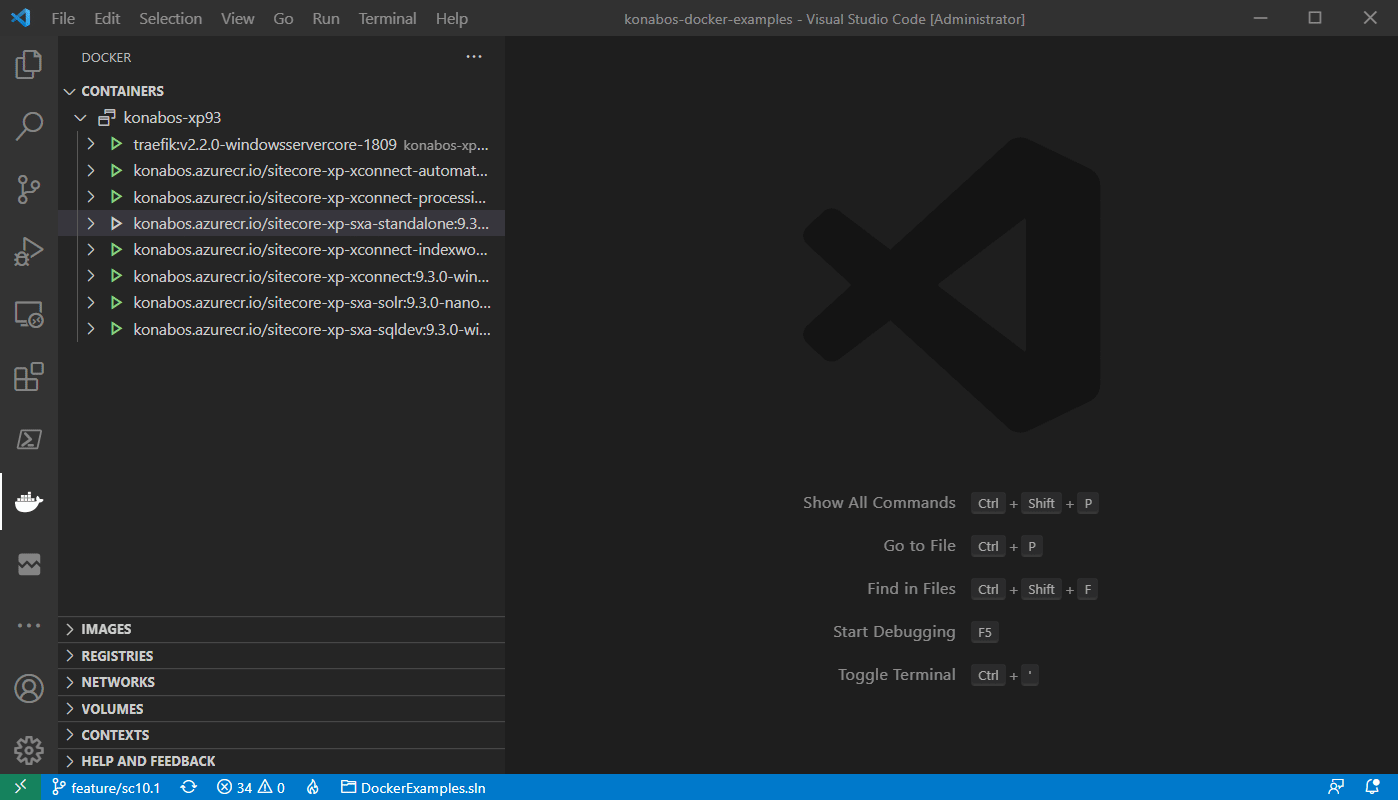
Edit added 12/Jan/2021 The tooling in VS Code for Docker has improved vastly in the past several months, be sure to read the documentation. For common usage, the tooling is great to visually see which containers are running, attach a shell into the container, browse and open or download the files from within the running containers, browse any connected container registries in your Azure subscription and a bunch of other stuff. This is one of my favourite visual tools for working with Docker.
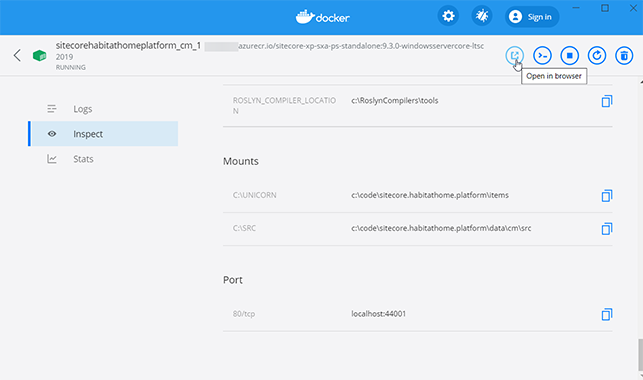
Docker Dashboard
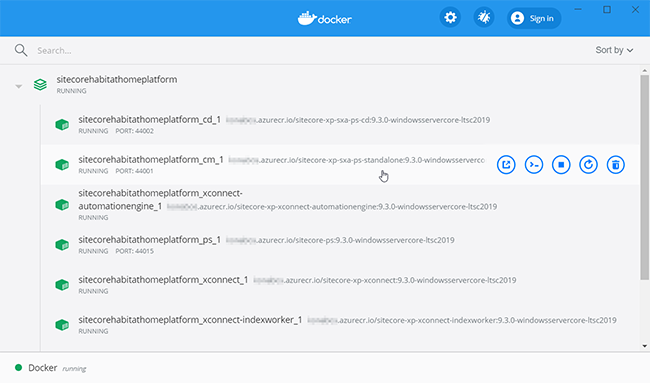
While you’re upgrading your software, make sure you have also upgraded to the latest version of Docker Desktop for Windows. As of writing, it is [2.2.0.5]. The latest minor update adds the Docker Dashboard feature. Again, this is information that is visible through from the command line (docker ps -a) but for those of us that are visual, this again adds a nice interface. The dashboard is somewhat similar to the Visual Studio integration, but it is useful to know for those team members who may not be using Visual Studio.
You can view all running containers, view the logs, inspect the environment variables/ports/mounts and also start/stop/restart/delete the application. There is also a link to open the application in the browser.
Debugging
At some point you will probably also want to debug your application. In the 3rd part of his series, Mark Cassidy walks us through the necessary steps. Fortunately, things have become a lot simpler due to the latest updates to Visual Studio and changes in the docker-images github repo.
First off, make sure you have installed the Visual Studio Remote Debugging Tools on your local machine. You can download them from here: https://visualstudio.microsoft.com/downloads/#remote-tools-for-visual-studio-2019
Next, the community Sitecore Docker Images repo has introduced a change in the entry point script which checks for the below volume mount, and if that exsists then it starts the remote debugger.
You no longer need to make any changes to the entrypoint parameter in your compose file, just the presence of this volume mount directory within the container is sufficient. Update your docker-compose file to add the below mount:
1cm:
2 image: ${REGISTRY}sitecore-xp-spe-standalone:${SITECORE_VERSION}-windowsservercore-${WINDOWSSERVERCORE_VERSION}
3 entrypoint: powershell.exe -Command "& C:\\tools\\entrypoints\\iis\\Development.ps1"
4 volumes:
5 - .\data\cm\wwwroot:C:\src
6 - .\data\cm\logs:C:\inetpub\wwwroot\App_Data\logs\
7 - C:\Program Files\Microsoft Visual Studio 16.0\Common7\IDE\Remote Debugger:C:\remote_debugger
That’s it, the remote debugger is now configured to run. Easy!
Note: Adjust the local Remote Debugger location according to your machine. If you enabled the tools as part of your Visual Studio install then it may be under a different folder, however the above should be correct if you installed the Remote Tools listed earlier.
If you are running the latest Visual Studio 2019, then you no longer need to add this volume mount. When you attach the debugger, the remote debugger tools are automatically downloaded and installed inside the container. Thank you Nick Wesselman for the tip
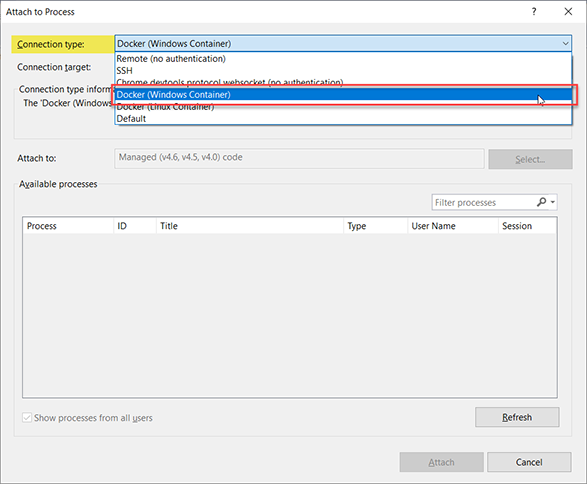
Thanks also to the added Docker support in the latest Visual Studio 2019, attaching to the container process is also much more simple. You no longer need to go through the process of figuring out the IP address and ports. Instead, just open up the Attach to Process window as normal (Ctrl + Alt + P or Debug > Attach to Process).
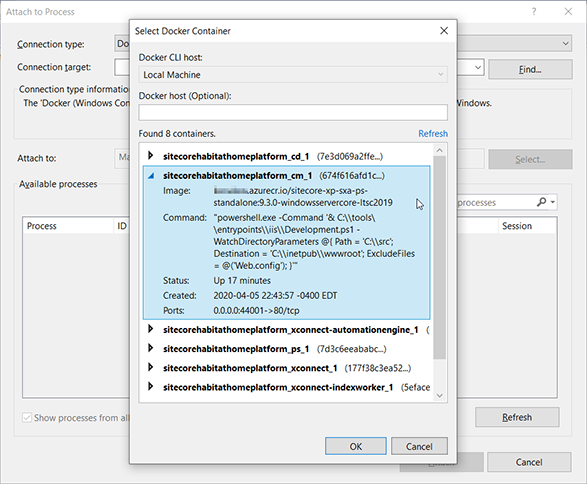
In the dialog, change the Connection Type to Docker (Windows Container). You can now hit Find in the Connection target option and you should be presented a list of all running containers. Select the container in which you wish to attach the debugger.
Be sure to select the Managed code option - breakpoints do not seem to be hit if you select Automatic - and also to check the Show processes from all users option in order to list the IIS Worker Process.
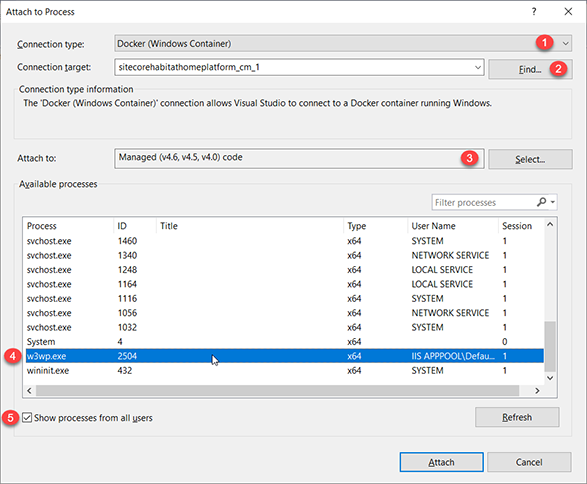
To summarise, it is important you set the following when you Attach to Process for debugging:
- Set the Connection Type to Docker
- Select the Connection Target to the container you wish to connect to (i.e. the CM instance)
- In the Attach to option, make sure you have selected the Managed Code option
- Select w3wp process from the available list
- Ensure that Show processes from all users has been selected if you don't see w3wp listed
As you can see, debugging your Docker applications from Visual Studio 2019 is now a much simpler process. What are you waiting for, go, and upgrade now! Please get in touch if you have any questions.

Kamruz Jaman
Kamruz is a 14-time Sitecore MVP who has worked with the Sitecore platform for more than a decade and has over 20 years of development and architecture experience using the Microsoft technology stack. Kamruz is heavily involved in the Sitecore Community and has spoken at various User Groups and Conferences. As one of the managing partners of Konabos Inc, Kamruz will work closely with clients to ensure projects are successfully delivered to a high standard.
Share on social media